Grids Functionality

Drive efficiency in your Salesforce org by giving your users a hyper productive interface all powered by our low code / no code Grid builder:
1. Inline Edit

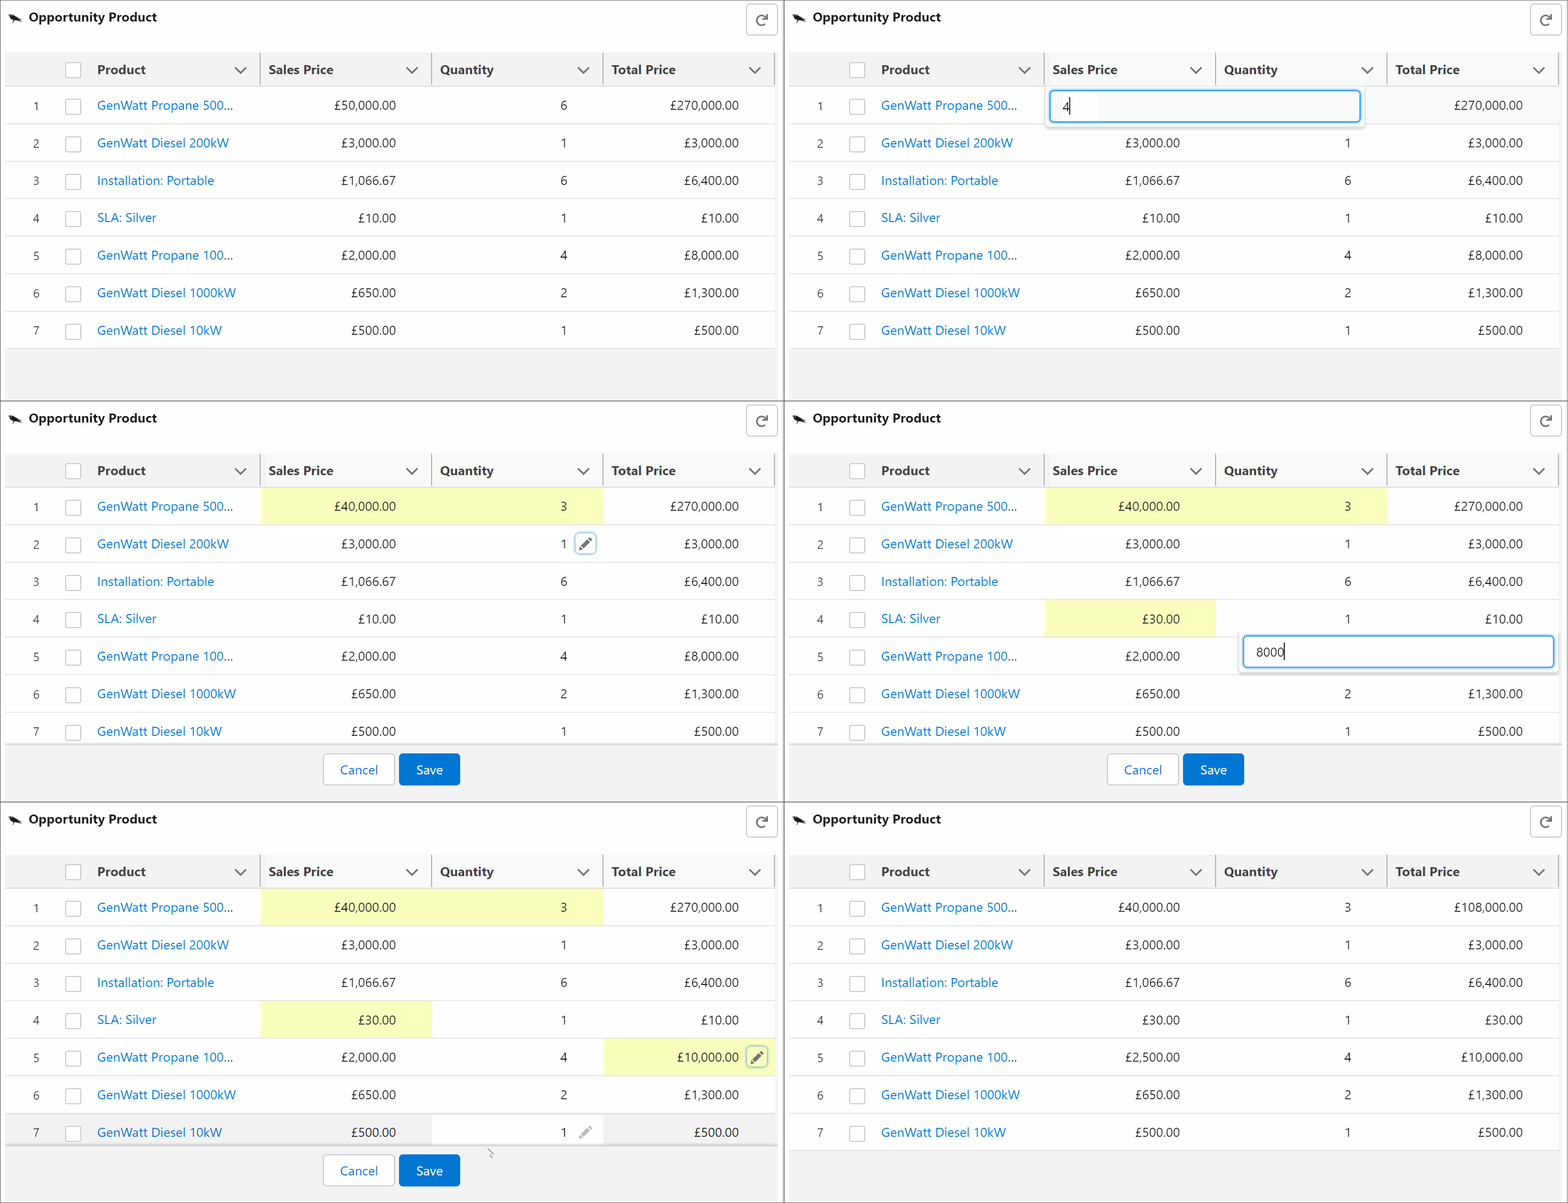
A table titled "Opportunity Product" listing products with columns for sales price, quantity, and total price. Products include GenWatt Propane and Diesel models, Portable Installation, and SLA: Silver. Currency is in British Pounds.

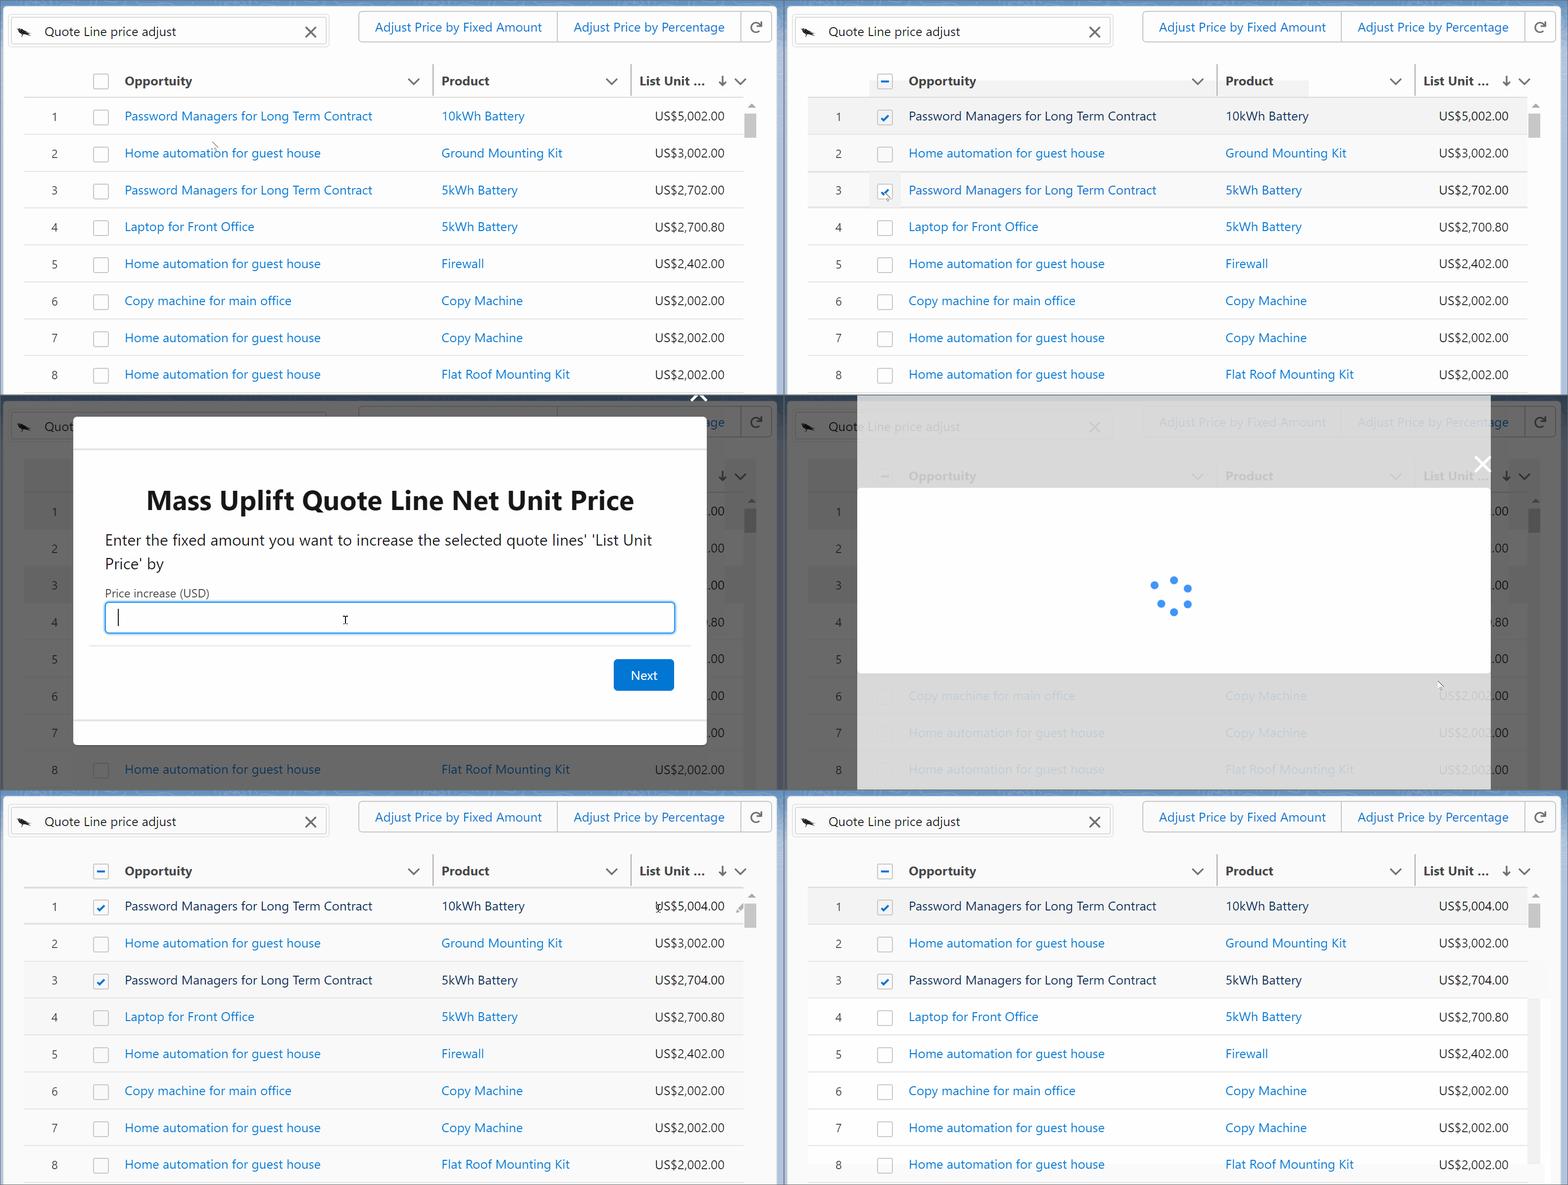
2. Launch a Flow

A computer screen showing a quote line price adjustment tool with a list of opportunities, products, and their respective prices in US dollars. Options to adjust prices by fixed amount or percentage are also visible.

3. Invoke ChatGPT (Beta)

Screenshot of a lead enrichment tool showing a sortable list of companies with columns for company name, website, and description. Companies listed include Asda, Zurich, Shure, Mulberry, Casio, and Coca Cola.

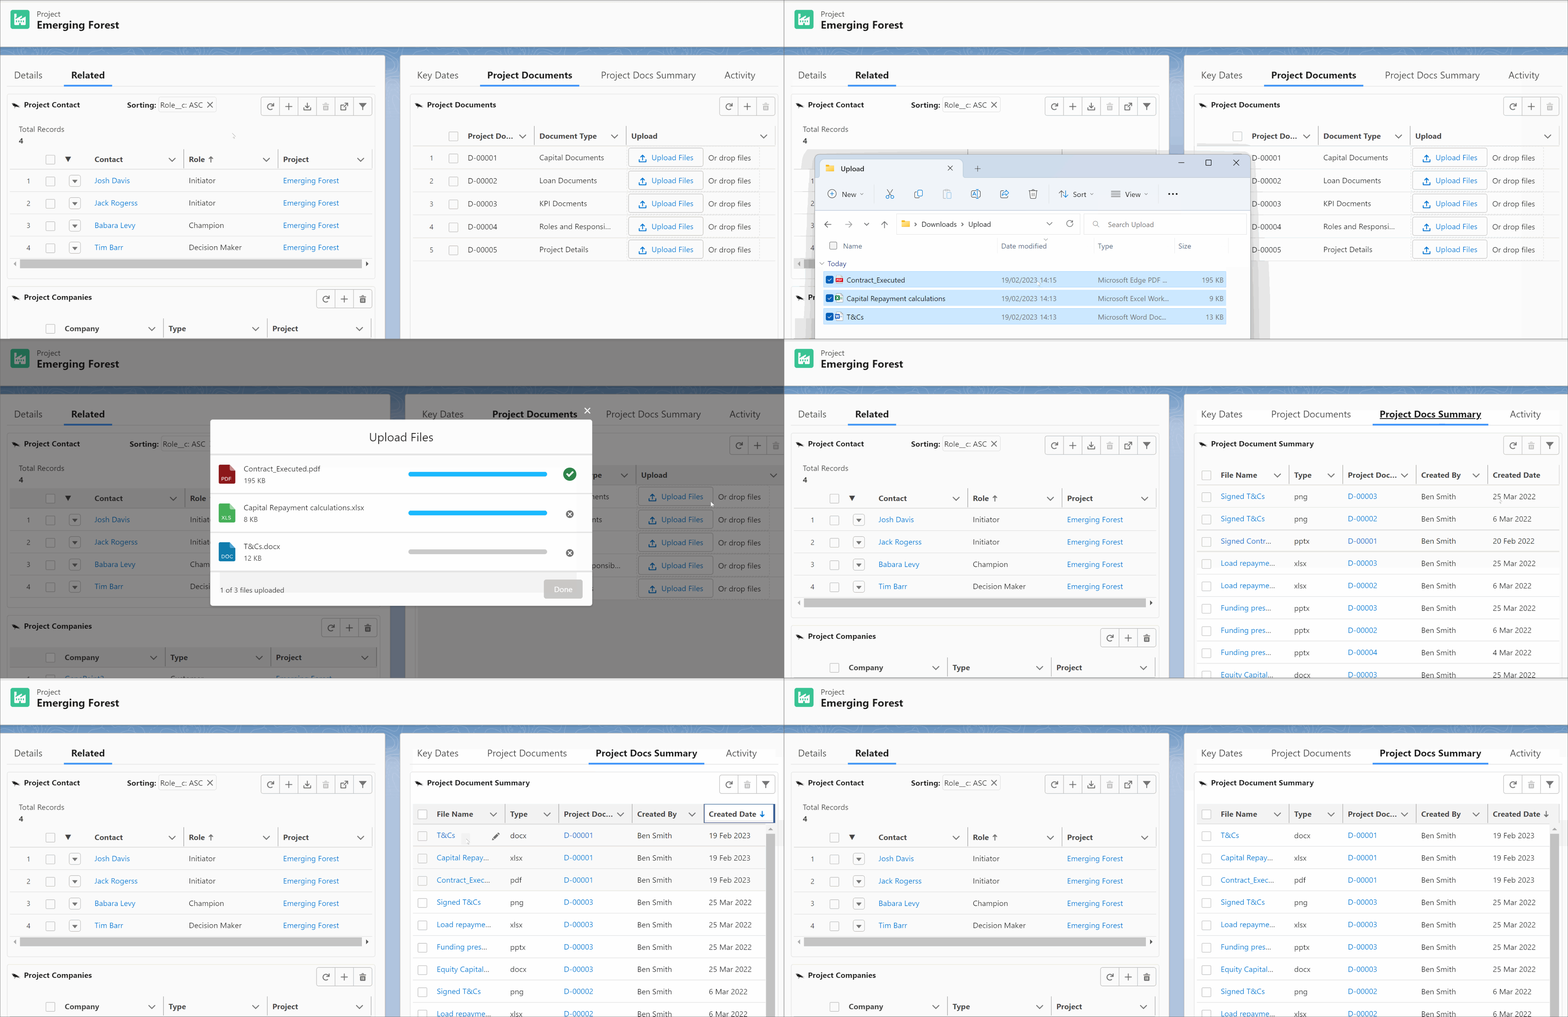
4. File Management

Screenshot of project management software interface showing two panels: one for project contacts with names, roles, and projects; the other for project documents with document IDs, types, and upload options for files.

5. Child Related Grids

Screenshot of a software interface displaying open opportunities, including account names, opportunity names, amounts, and close dates. Sorting criteria are displayed at the top. Highlighted dates include "30 Aug 2023." Total records are listed as 36, with a total amount over £12 million.

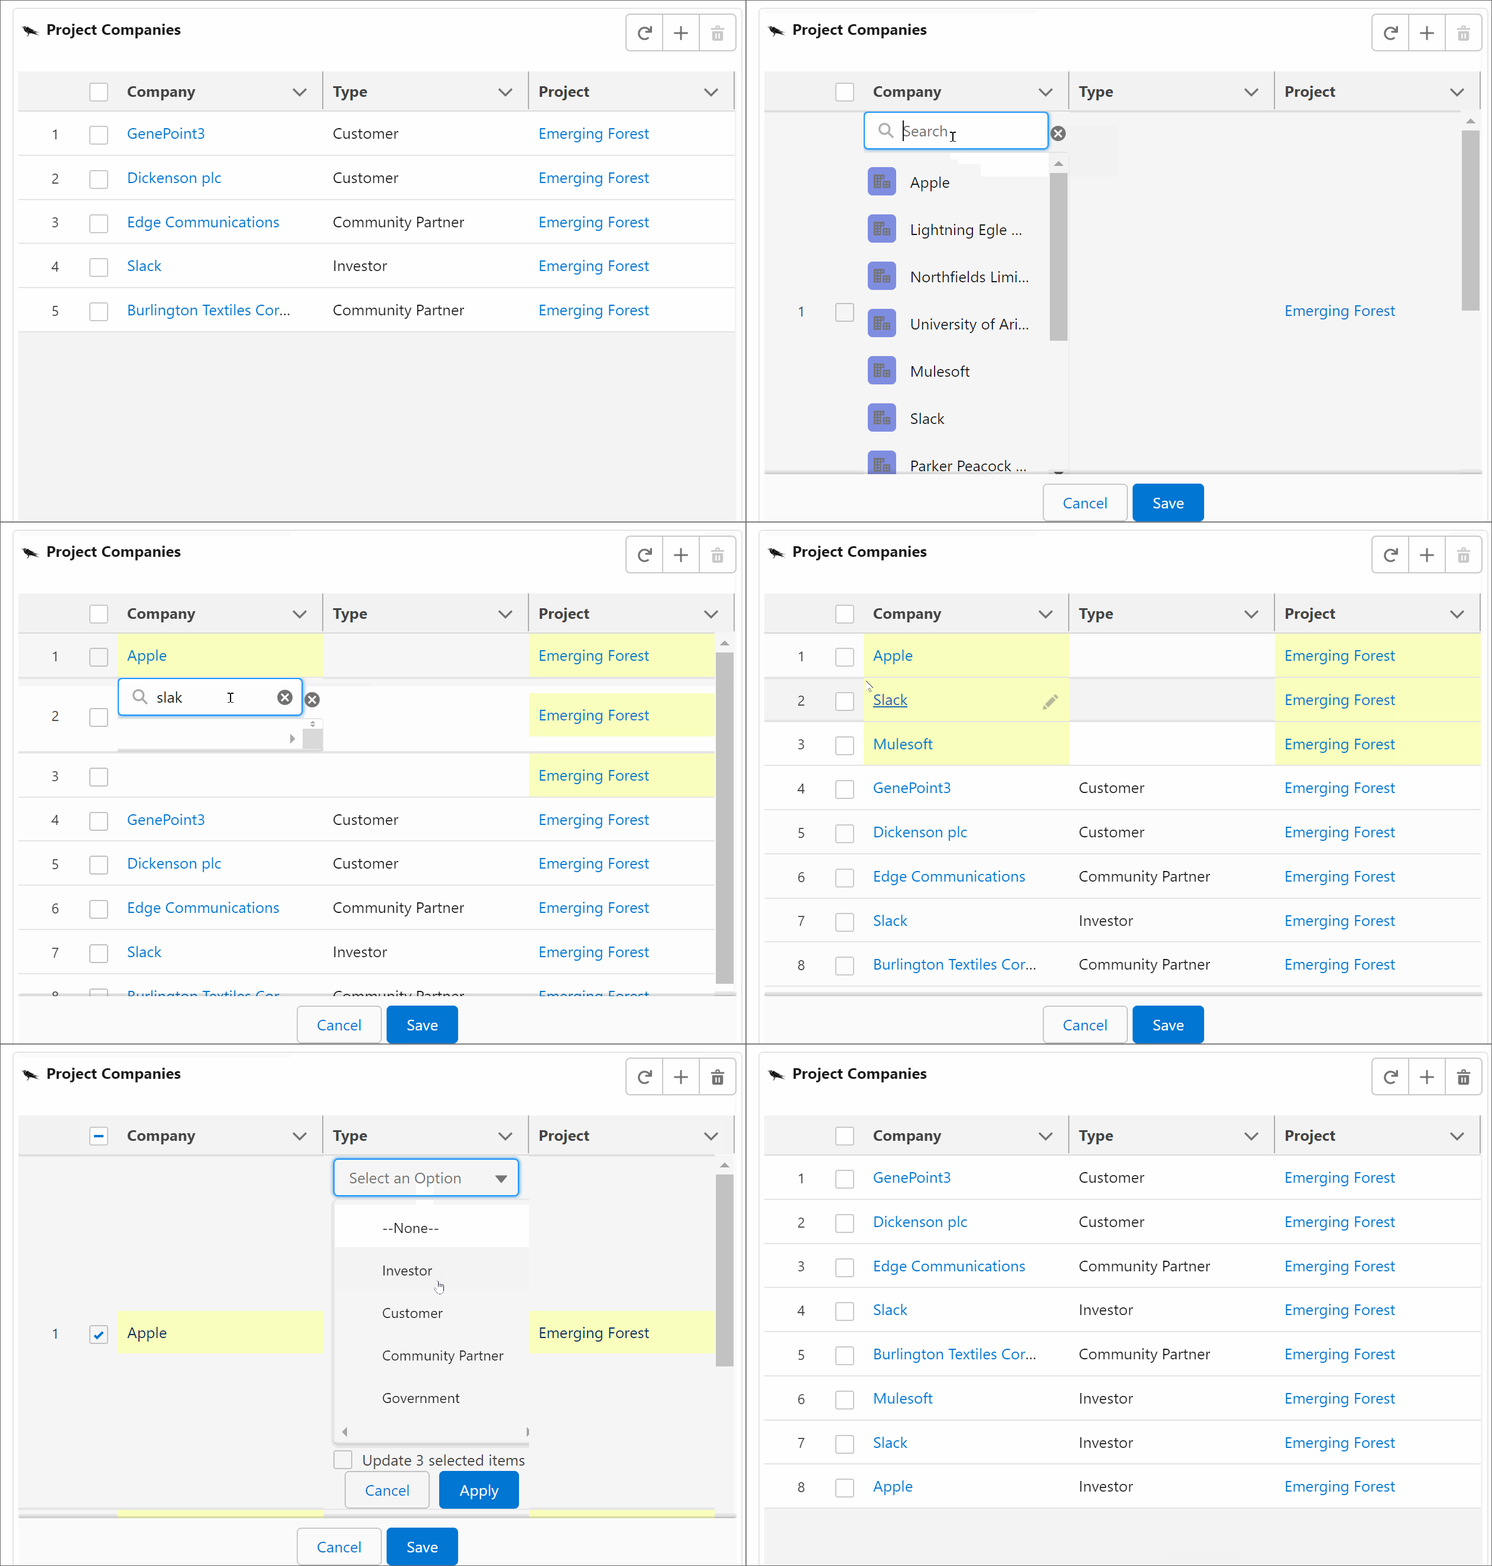
6. Inline Create

A table titled "Project Companies" listing five companies with columns for Company, Type, and Project. Companies include GenePoint3, Dickenson plc, Edge Communications, Slack, and Burlington Textiles Corp., all associated with the "Emerging Forest" project. Types include Customer, Community Partner, and Investor.

7. Mass Update

Screenshot of a case management dashboard displaying a list of cases with columns for subject, status, and origin. Cases include issues like "Short circuit," "Battery," and "Easy installation process." Statuses vary between working, new, and closed, with origins like phone, email, and web.

8. Mass Delete

Screenshot of a CRM dashboard showing a list of cases with columns for Subject, Status, and Origin. Cases include issues like 'Short circuit' and 'Beams' with statuses such as 'Closed' and 'Working.' Origins include 'Phone,' 'Email,' and 'Web.'

9. Mass Filter

A screenshot of a case management system displaying a list of cases. Columns shown include Subject, Status, and Origin. Case subjects include 'Electrical shortcircuit' and 'Maintenance guidelines for generator.' Statuses vary from 'Closed' to 'New' and 'Escalated,' while origins include Email, Web, and Phone.

10. Mass Sort

A screenshot of a case management system dashboard with columns for subject, priority, status, and origin. All cases have a high priority and various statuses such as new, working, escalated, and closed, originating from phone, web, and email channels. Sorting is by priority and status, in descending order.

11. Download

Screenshot of a software application interface displaying a case management table with columns for subject, priority, status, and origin. The priority column shows statuses like High, Medium, and Low in different colors. The status column lists entries as 'New.' The interface includes navigation options such as Grids, Explorer, and Reports.

12. Conditional Formatting

Customer support dashboard displaying a table of cases with columns for subject, priority, status, and origin.

13. Dynamic Summaries

Screenshot of a sales product opportunity table displaying product names, sales prices, quantities, and total prices for each listed item, with an overall total price of £129,230.00.

14. Sparklines

A data table listing contract names, products, and prices. Columns include contract name, product, product family, list unit price, and a graphical price history. Items listed include Home Security Console, Headphones, Ground Mounting Kit, and others, with prices shown in US dollars and corresponding price trends displayed as graphs.

15. Add Grid to a record page

Screenshot of a project management interface for "Emerging Forest," showing related project contacts, companies, and key dates. The left panel lists project contacts with roles such as Initiator and Champion, and companies categorized as customers or partners. The right panel displays project key dates with types and comments.

16. Quick select Grids using Explorer

Minimalist digital landscape with mountains, trees, clouds, and sun, on a webpage interface with navigation menu and search bar.

17. Many Many Columns

A software interface displaying a table titled "Year Revenue" with data on total records and a grand total of £171,600. It lists project descriptions for various companies like Oracle, Quip, Salesforce, IBM, Slack, and Apple, along with associated earnings for different months. The software menu includes items like Home, Explorer, and Reports, indicating a business management platform.

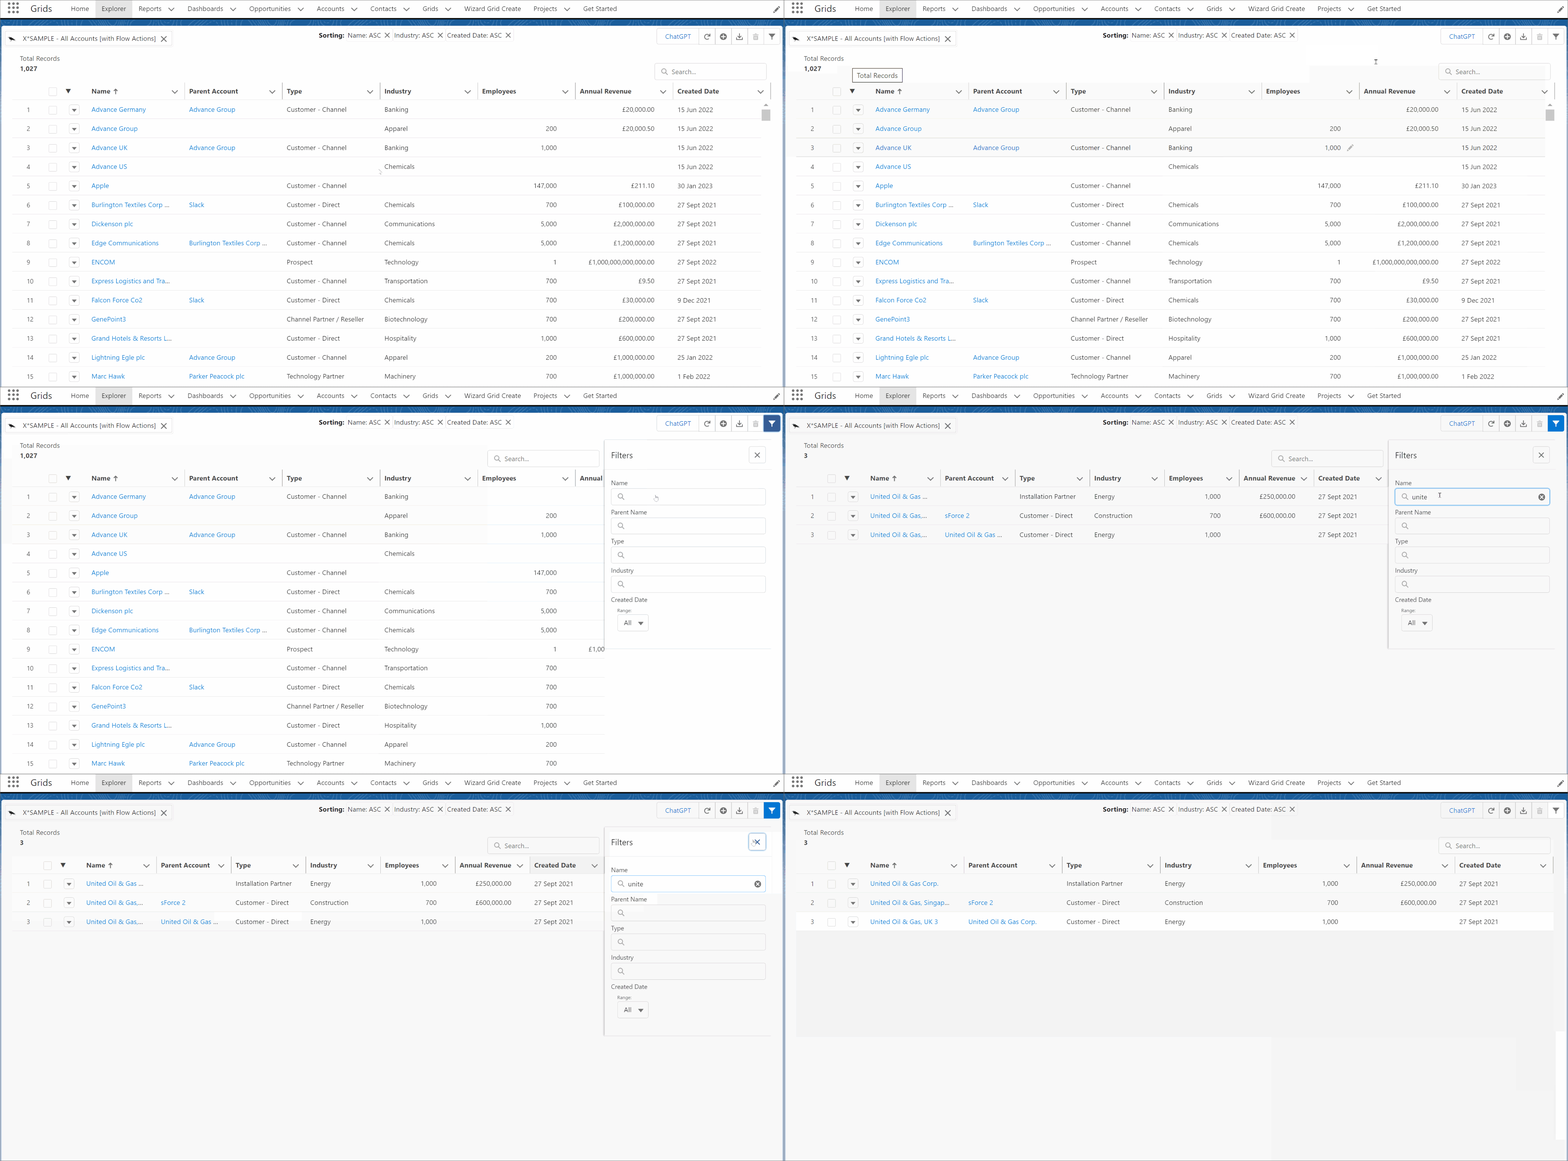
18. Many Many Rows

Salesforce grid view showing a table of accounts with columns for name, parent account, type, industry, employees, annual revenue, and created date. Includes various company names and financial data.

19. Clone Rows

Screenshot of a CRM opportunities page, titled "3. Opportunities," showing a list of 8 opportunities with columns for "Related," "Opportunity Name," "Opportunity Owner," "Account Name," "Amount," "Expected Revenue," and "Close Date." Sorting options and total records, amount, and expected revenue are displayed at the top.

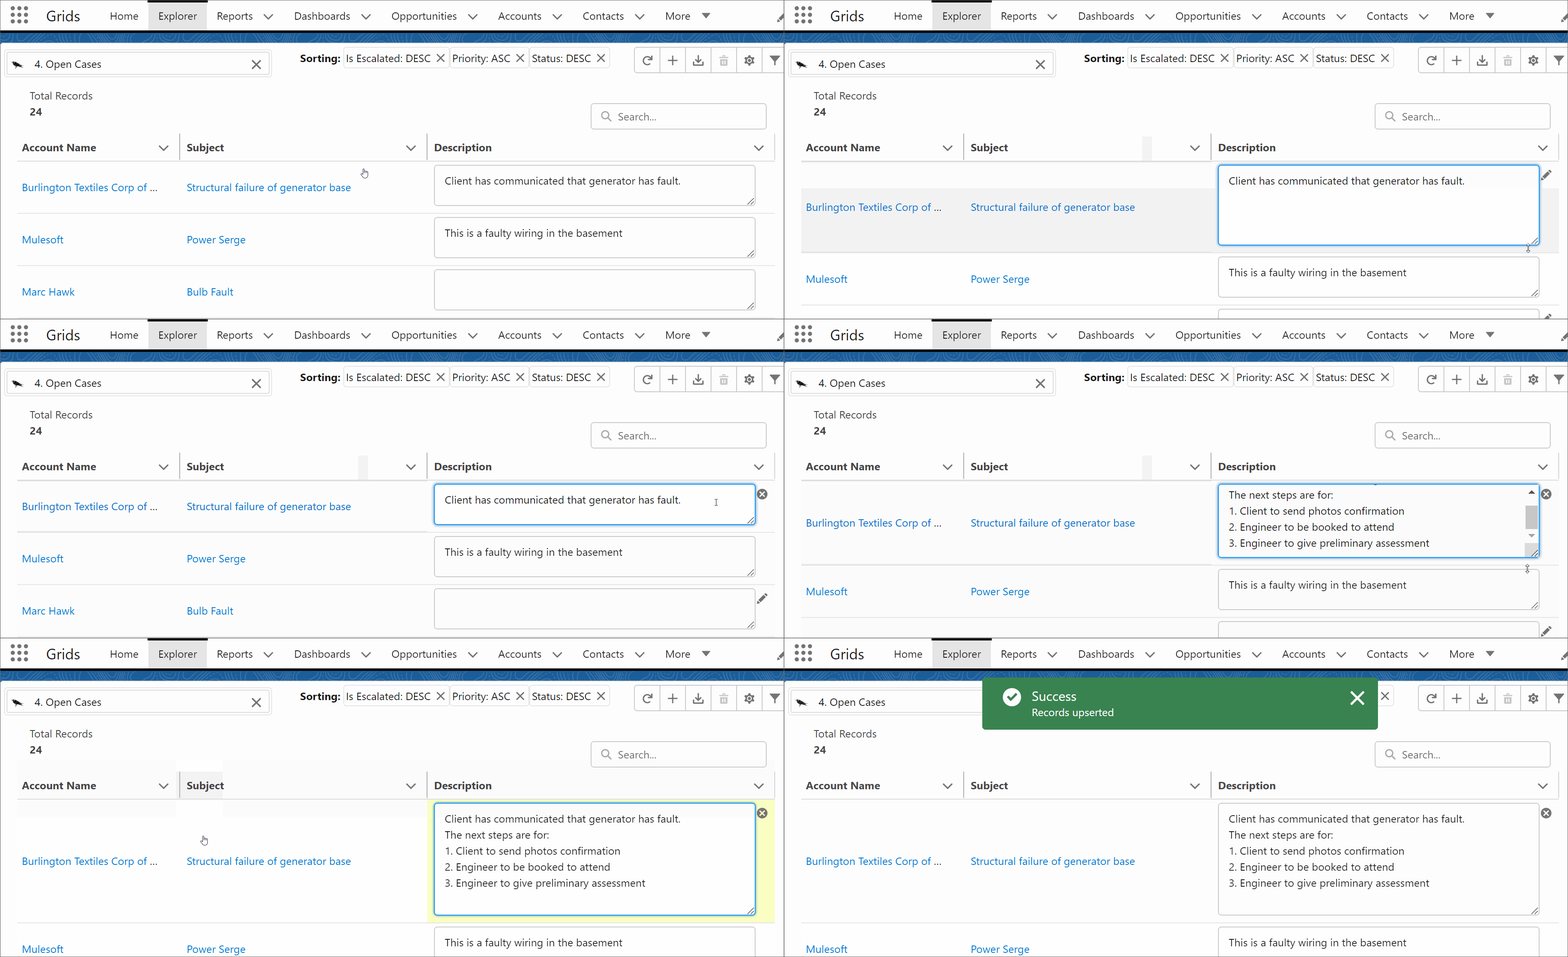
20. Text Area inline edit

Salesforce screen displaying open cases with account names, subjects, and descriptions for each case. Sorting options and navigation menu are visible at the top.

21. Experience Cloud Grids

A computer interface showing an open cases dashboard with a list of cases, priorities, origins, statuses, and escalation status. The priority column is color-coded with red for high, orange for medium, and green for low. There are navigation links for Home, Support, and Cases at the top, and a search bar and user menu in the upper right corner. Quick links include Delivery Tracking, Communications History, Upcoming Events, and User Guide.

22. Click to dial

Screenshot of a table showing leads with columns for total records, first name, last name, company, and phone number. Two entries are visible: Bertha Boxer from Farmers with a phone number, and Phyllis Cotton from Anglo A with a phone number.

23. End User Column Settings

Data table displaying company information with columns for name, parent, annual revenue, quarter-over-quarter revenue, number of employees, partnership status, type, and industry. The interface includes options for sorting and searching, with visual graphs showing revenue trends for each entity.

24. Dynamic Grids

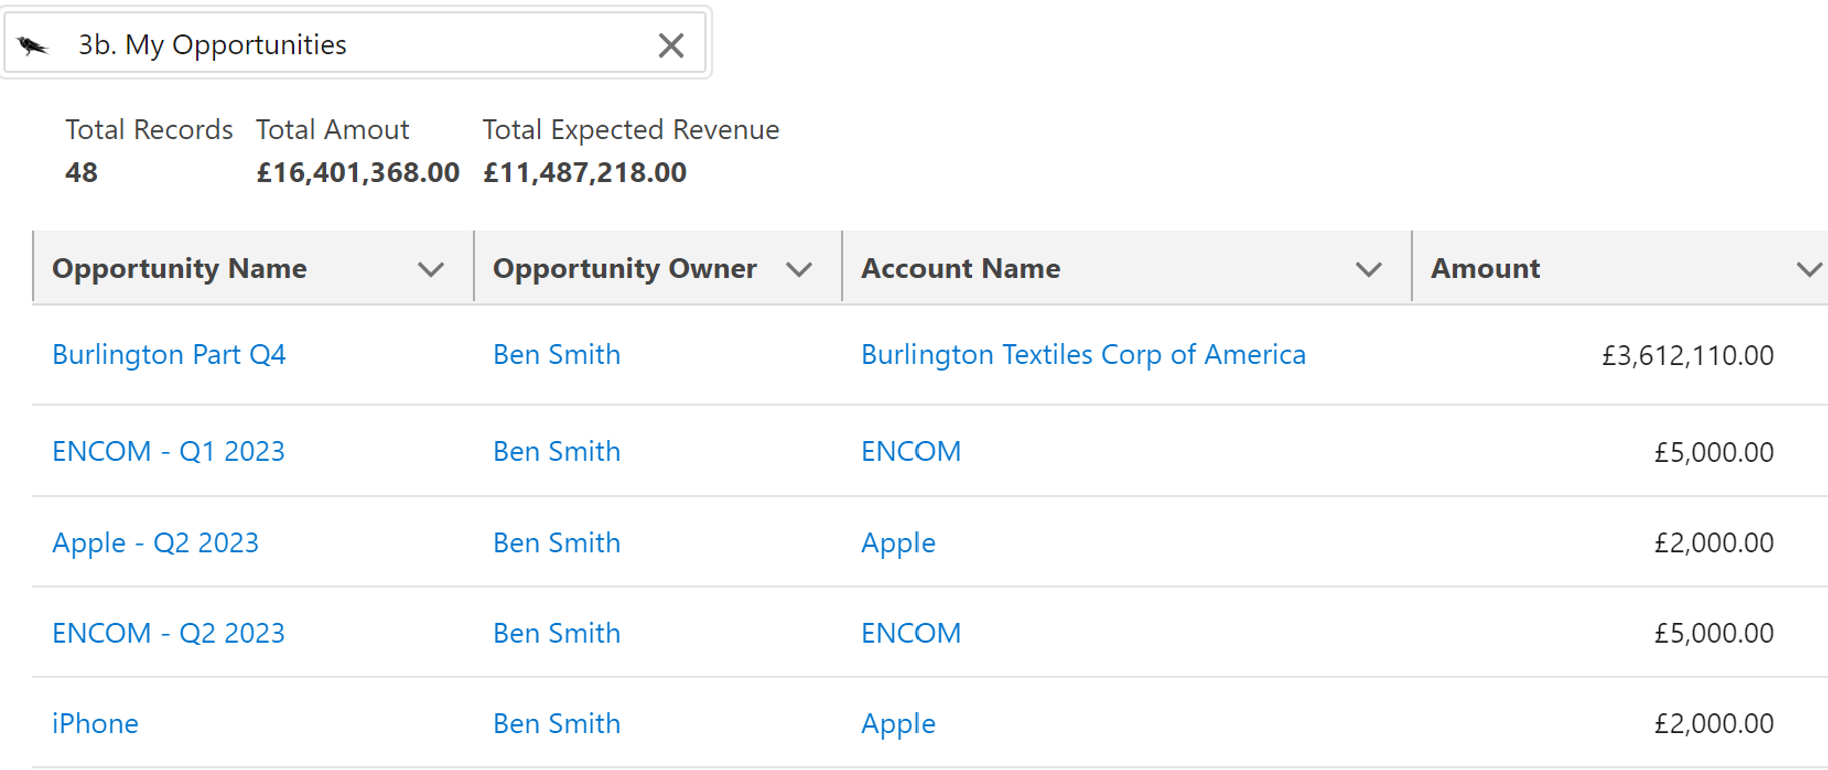
Sales dashboard displaying opportunities with columns for "Opportunity Name," "Opportunity Owner," "Account Name," and "Amount." Contains data such as total records, total amount, and expected revenue in British Pounds. Highlighted opportunities include "Burlington Part Q4" and "ENCOM - Q1 2023."

25. Completion Bars

A spreadsheet displaying a list of business opportunities with columns for "Related," "Opportunity Name," "Stage," "Probability Bar," "Amount," and "Close Date." Each row details an opportunity, such as "Gas maintenance contract" with a probability of 90% and a close date of Nov 9, 2023."

26. Rich Text inline edit

Text editor interface showing project follow-up points, including finalizing a proposal document, completing a letter of intent, and conducting a computation analysis for seven teams. The teams are listed as commercial, sales, marketing, facilities, operations, and legal. A reconvene date is set for Monday 22nd July, highlighted in red.

27. Connect unrelated data

Animated 3D lattice structure with glowing center point, blue and green lines connecting nodes, resembling a network or grid pattern.

28. Usage Insights

Donut chart and bar graph displaying RavenApps grids usage by impression type and by date and user, including data for Ben Smith and Peter Gascoyne. The donut chart shows most usage in 'Grid Impression' and 'Filters' categories. The bar graph depicts usage over time, with peaks on specific dates.

29. Grid Views

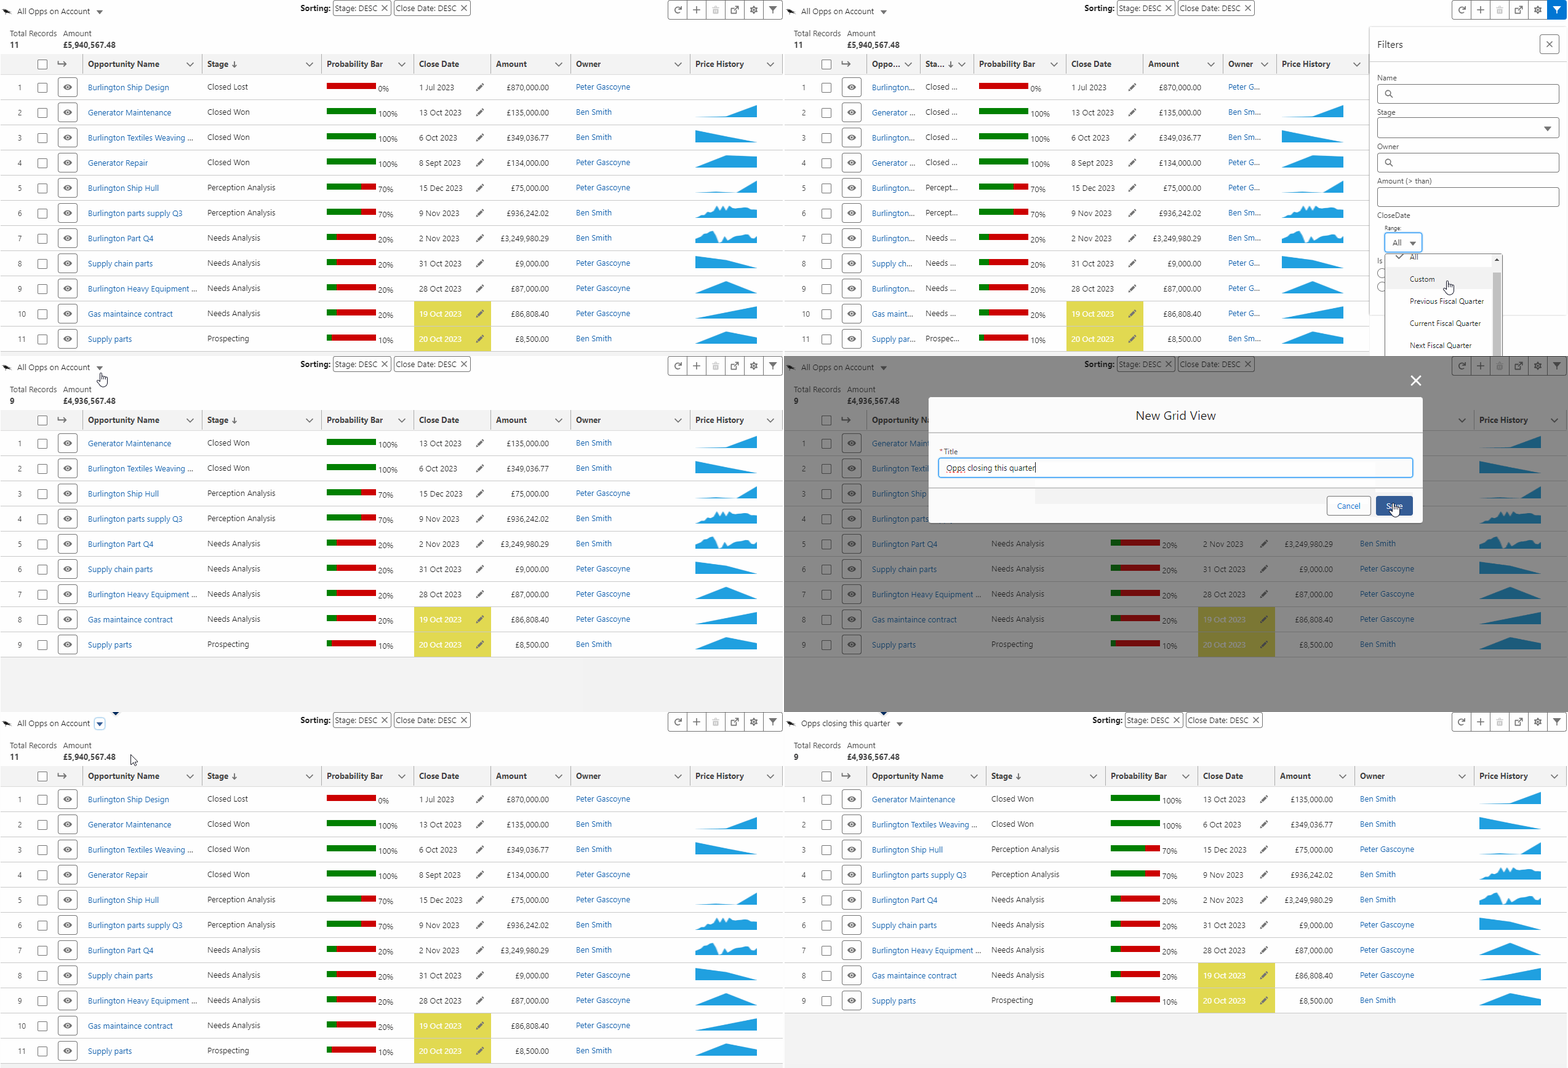
Sales opportunity dashboard showing opportunity names, stages, probability bars, close dates, amounts, owners, and price history charts.

30. Parent Field Inline Edit

Screenshot of a campaign management interface showing 'Fixed Income Q4 Bidding' campaign details. Includes columns for contact names, accounts, phone numbers, emails, MiFID II status, response statuses, and job titles. Contacts are listed with various companies like Progress Bank UK and Blackstone Group, with statuses indicating whether they have been sent information or responded."

31. Dynamic Icon values

Spreadsheet displaying payroll steps with columns for step name, status, planned date, handler, SLA status, and payrun. Includes entries such as 'Data Input' and 'Test Run' with various open or closed statuses and planned dates.

32. Freeze Columns

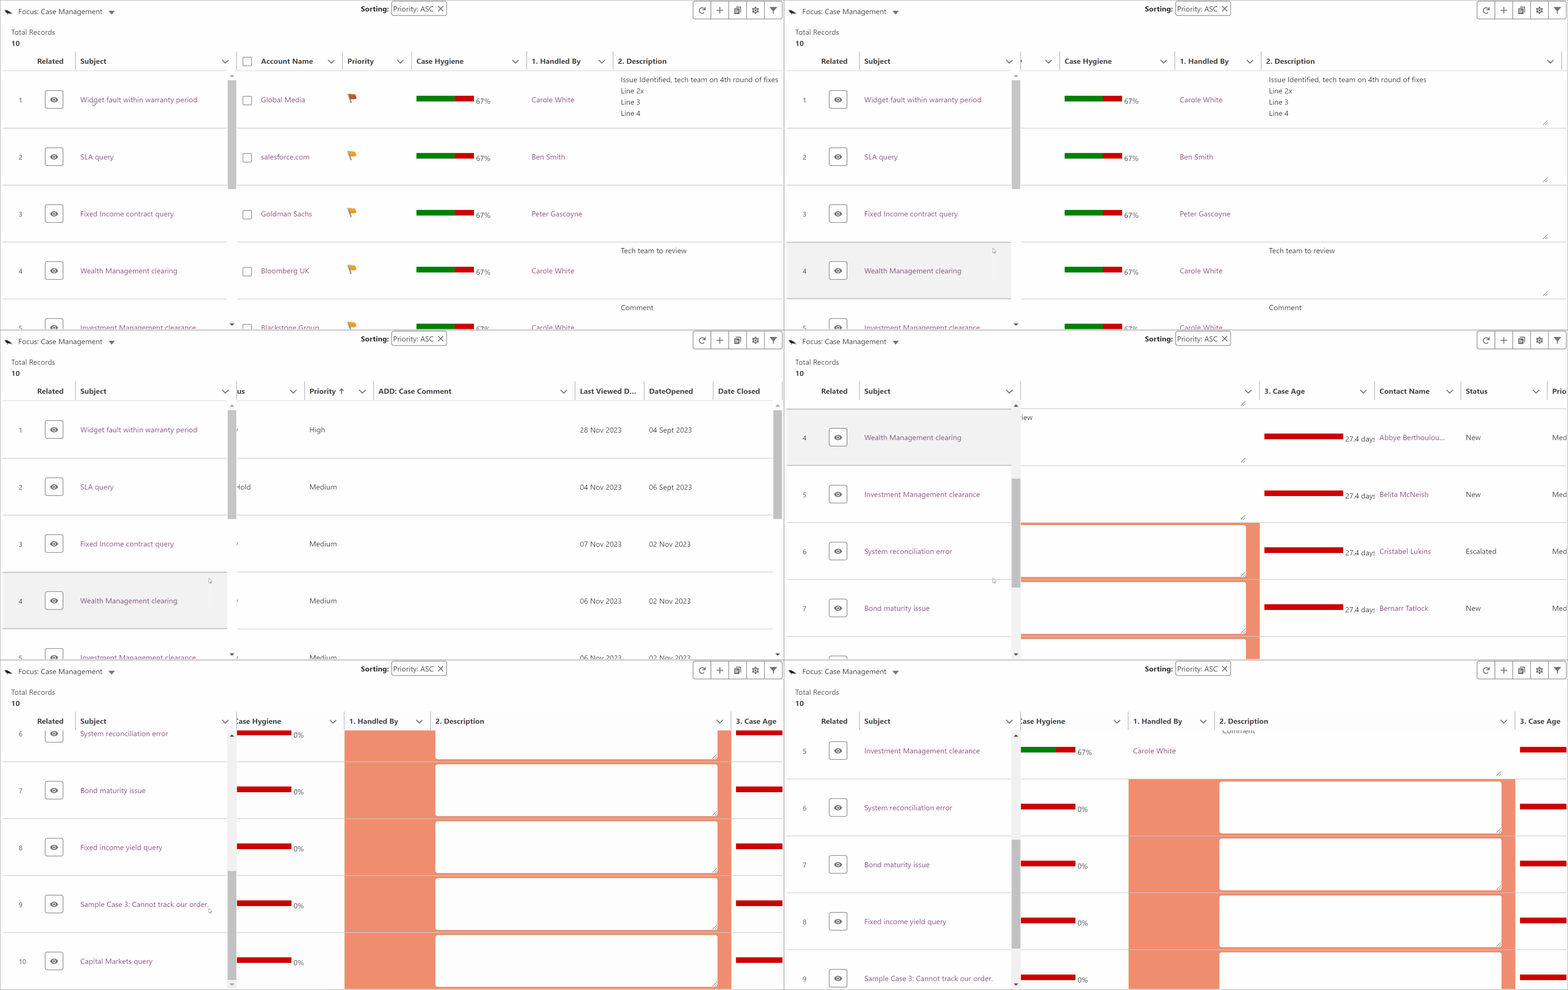
Case management interface displaying records for various issues. Columns include "Related," "Subject," "Account Name," "Priority," "Case Hygiene," "1. Handled By," and "2. Description." Records list companies and handlers, with progress bars indicating case hygiene percentage, all sorted by priority in ascending order. Additional icons for sorting and filtering are visible at the top.

33. Many More …

Stairway leading to a bright horizon with sunlight and clouds